The scale_*_date_** functions provide nice defaults for plotting
the appropriate date_xx subclass, but come with a limited number of
configuration options. If you require more finetuning, you can convert
date_xx vectors with as.Date() and use ggplot2::scale_x_date().
scale_x_date_yq(
  name = "Quarter",
  breaks = date_yq_breaks(),
  labels = ggplot2::waiver(),
  limits = NULL,
  position = "bottom"
)

scale_y_date_yq(
  name = "Quarter",
  breaks = date_yq_breaks(),
  labels = ggplot2::waiver(),
  limits = NULL,
  position = "left"
)

scale_x_date_ym(
  name = "Month",
  breaks = date_ym_breaks(),
  labels = ggplot2::waiver(),
  limits = NULL,
  position = "bottom"
)

scale_y_date_ym(
  name = "Month",
  breaks = date_ym_breaks(),
  labels = ggplot2::waiver(),
  limits = NULL,
  position = "left"
)

scale_x_date_yw(
  name = "Week",
  breaks = date_yw_breaks(),
  labels = ggplot2::waiver(),
  limits = NULL,
  position = "bottom"
)

scale_y_date_yw(
  name = "Week",
  breaks = date_yw_breaks(),
  labels = ggplot2::waiver(),
  limits = NULL,
  position = "left"
)
Arguments
| name | The name of the scale. Used as the axis or legend title. If
|
|---|---|
| breaks | One of:
|
| labels | One of:
|
| limits | One of:
|
| position | For position scales, The position of the axis.
|
Examples
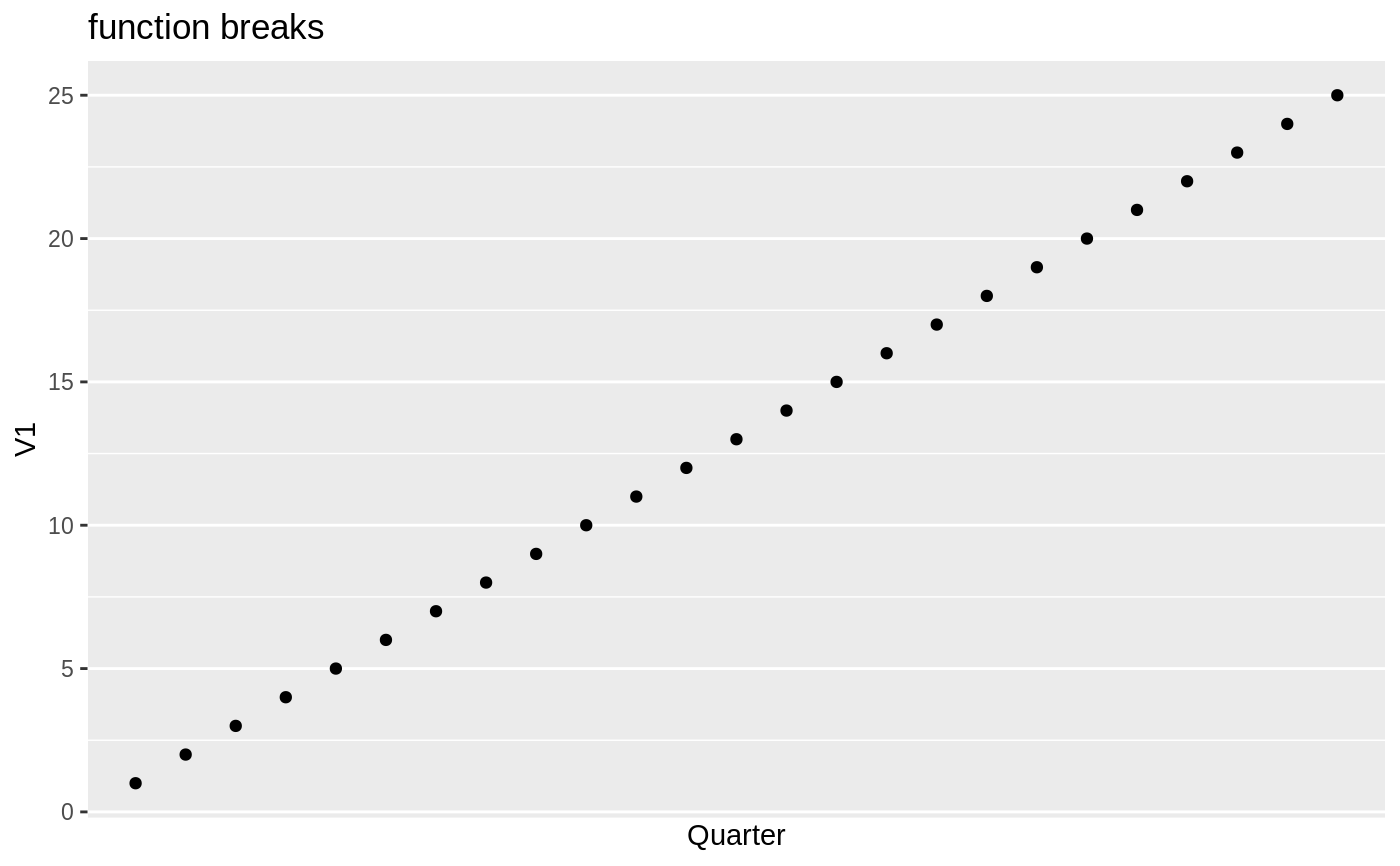
if (require("ggplot2", quietly = TRUE)){

dd <- data.frame(date = seq(date_yq(2016, 1), date_yq(2018, 1)), V1 = 1:9)
p <- ggplot(dd, aes(x = date, y = V1)) +
  geom_point()

p  # automatically uses the proper scale
p + scale_x_date_yq("quarters with default spacing")
p + scale_x_date_yq(breaks = date_yq_breaks(3))


# Different ways to specify breaks and labels
p <- ggplot(
  data.frame(date = seq(date_yq(2012, 4), date_yq(2018, 4)), V1 = 1:25),
  aes(x = date, y = V1)
) +
  geom_point()

p + scale_x_date_yq(labels = waiver()) + ggtitle("auto Labels")
p + scale_x_date_yq(labels = NULL) + ggtitle("no Labels")
p + scale_x_date_yq(labels = LETTERS[1:4]) + ggtitle("manual Labels")
p + scale_x_date_yq(labels = format_yq_iso) + ggtitle("function Labels")

p + scale_x_date_yq(breaks = waiver()) + ggtitle("auto breaks")
p + scale_x_date_yq(breaks = NULL) + ggtitle("no breaks")
p + scale_x_date_yq(breaks = date_yq(2013, 2:3) ) + ggtitle("manual breaks")
p + scale_x_date_yq(breaks = date_yq_breaks(1) ) + ggtitle("function breaks")
}